Operational Risk Analysis
XGBoost model that predicts job-level risk (completed / delayed / failed) on a hybrid manufacturing line, with SHAP turning predictions into actionable maintenance and scheduling insight.
- 92.5%
- test accuracy
- 0.928
- weighted F1
- 1,000
- production jobs
My role
Owned the full analysis — feature engineering, XGBoost modeling and tuning, SHAP-based interpretation, and translating the results into operational recommendations.
Problem
A hybrid manufacturing line ran 1,000 production jobs across 5 machines (M01–M05) and 5 operation types (Lathe, Grinding, Milling, Additive, Drilling). Nearly a third of jobs did not complete cleanly — 19.8% were delayed and 12.9% failed — pointing to significant operational risk.
The goal was to identify which production factors drive delays and failures, so scheduling, machine maintenance, and resource allocation could be targeted where they actually matter.
Approach
I framed this as a 3-class classification problem (Completed / Delayed / Failed) using XGBoost, chosen for its strength on small-to-medium tabular data, native multi-class support, robustness to outliers, and full SHAP compatibility for explainability.
The model used 7 input features, three of them engineered from raw timestamp columns: Scheduled_Duration, Start_Delay, and a composite Risk_Score (availability, energy, material, delay). It was tuned with 200 estimators, max depth 5, and a 0.08 learning rate, then validated with a stratified 80/20 split and 5-fold Stratified K-Fold cross-validation.
SHAP values were used throughout to interpret each feature's contribution per class and turn the model into actionable insight rather than a black box.
Results
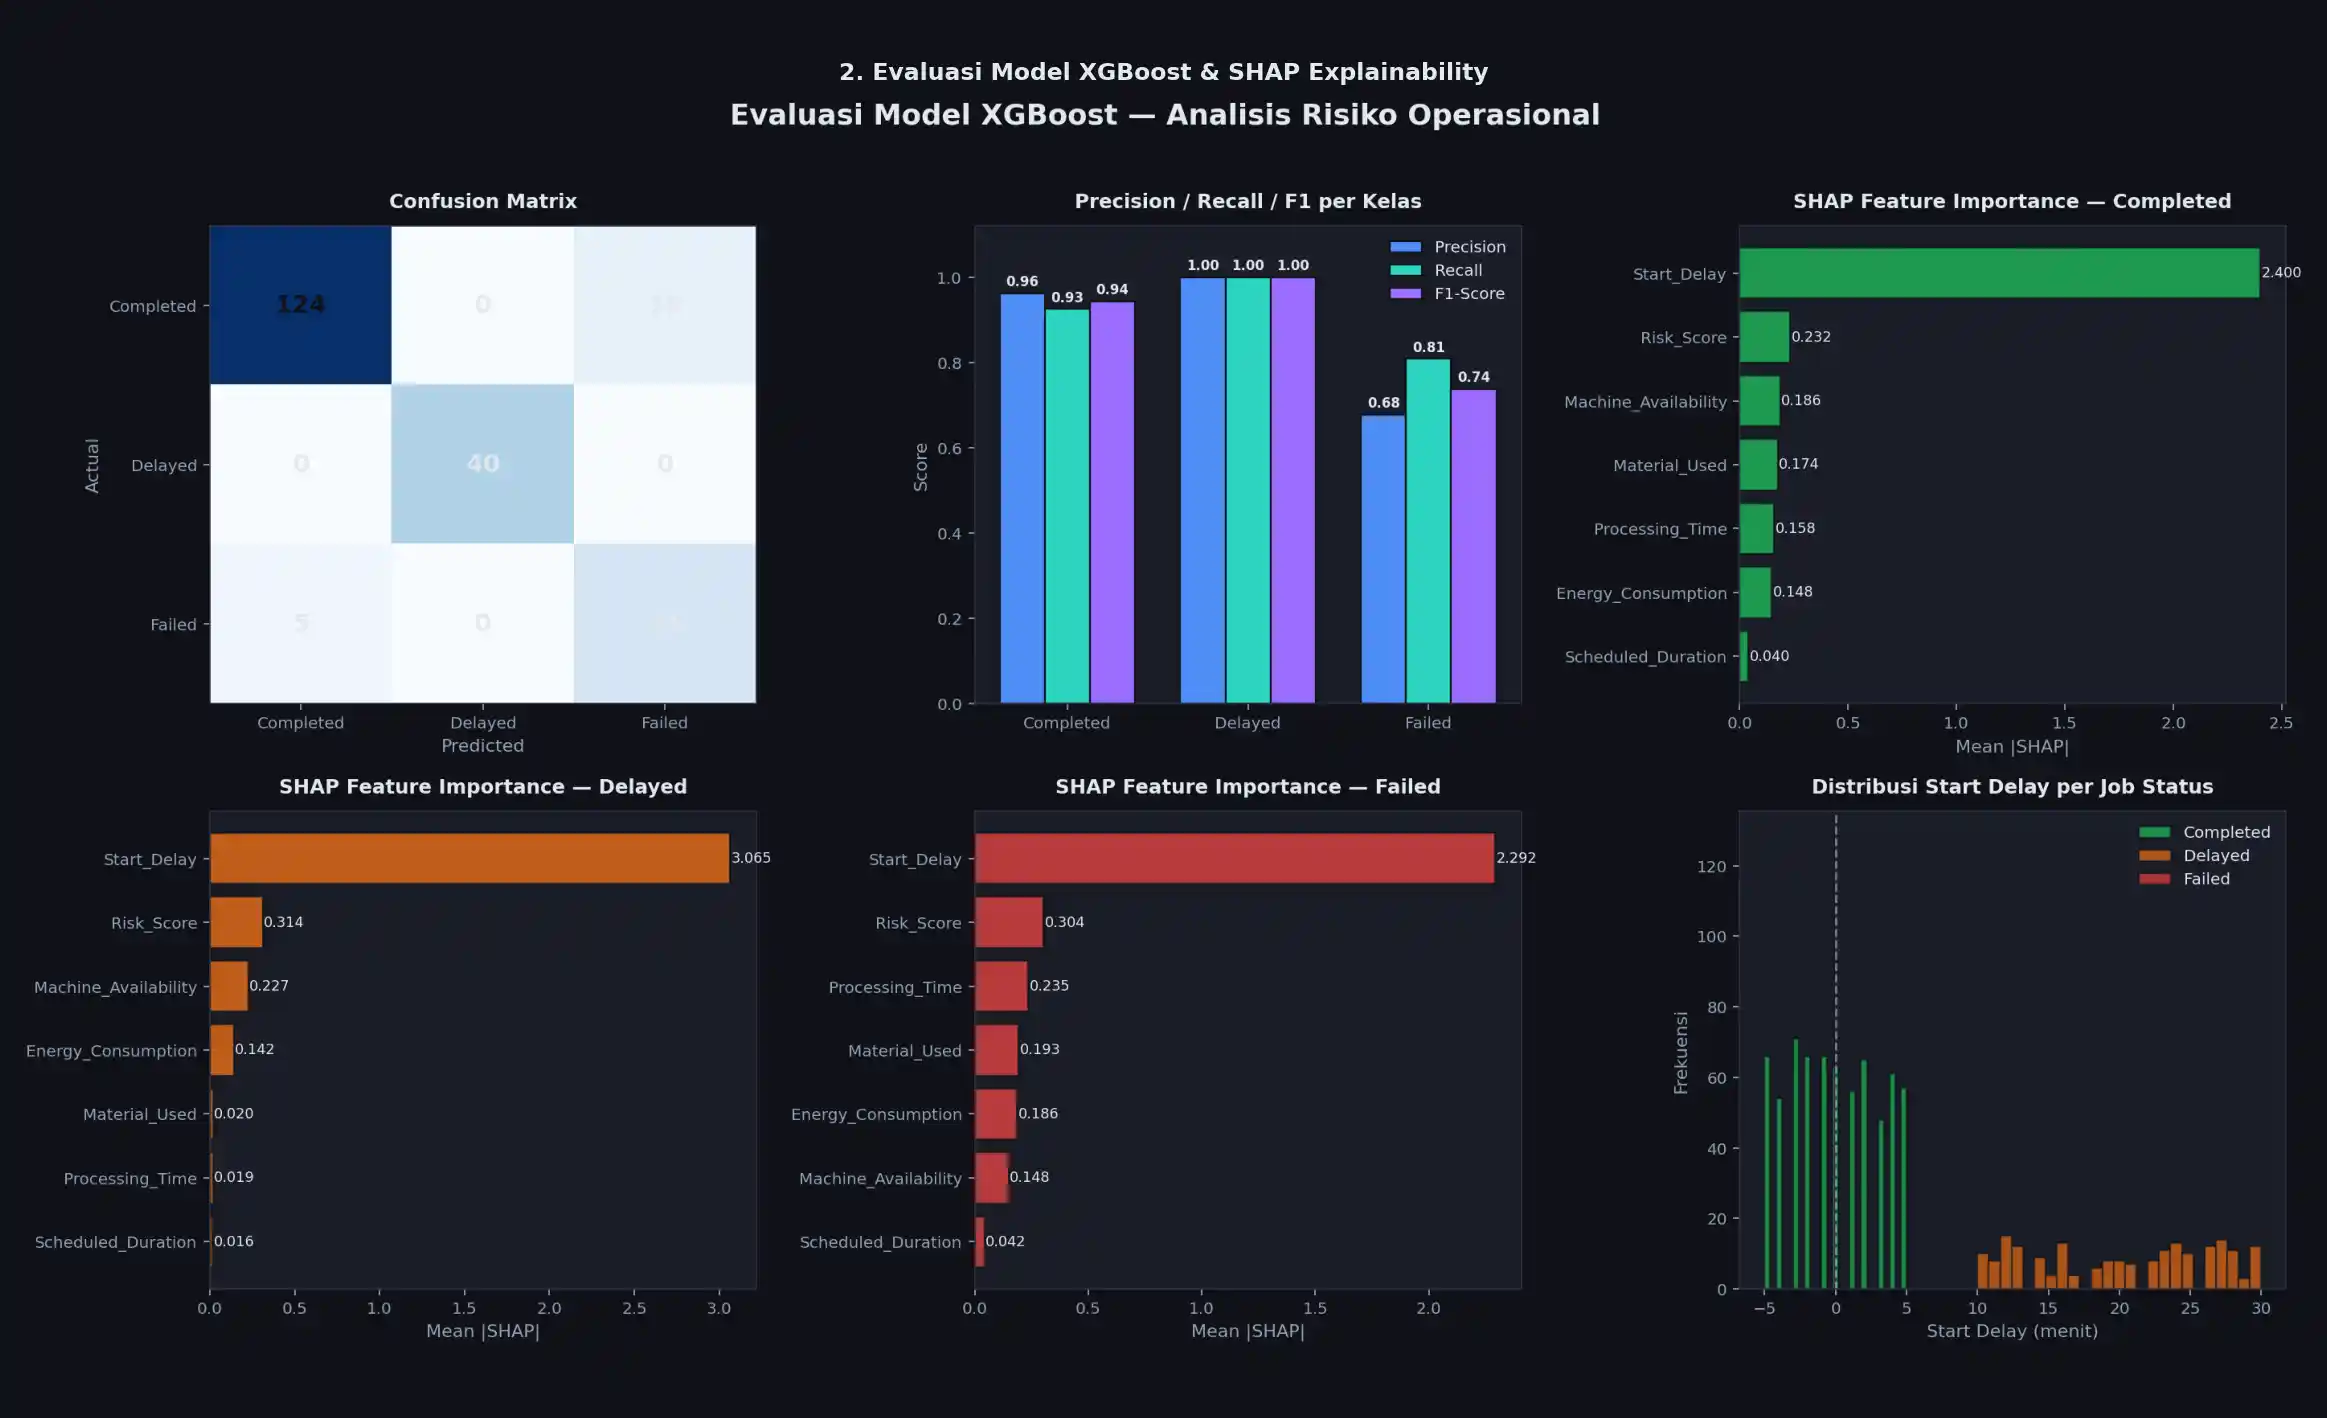
- Reached 92.5% test accuracy and 92.4% mean cross-validation accuracy with a 0.928 weighted F1 — stable across folds.
- Per-class performance was sharp where patterns were distinctive (Delayed F1 = 1.000) and weakest where Failed and Completed jobs overlapped on technical factors (Failed F1 = 0.737).
- SHAP identified Start_Delay as the single dominant risk driver (importance 2.586, far above any other feature): delayed jobs averaged +20.15 min start delay versus −0.15 min for completed ones.
- The composite Risk_Score worked as an effective early-warning indicator (avg 9.42 for delayed vs ~7.6 for the other classes).
- Pinpointed Machine M03 and the Drilling operation as the highest-risk combination, and showed that failures stem from intrinsic machine/material conditions rather than scheduling — a direct case for preventive maintenance over schedule tweaks.