Flood Impact Segmentation
A 10-class Swin Transformer + FPN model that maps flood impact from aerial imagery, built for the national Dolanan Data NEXUS 2026 competition — a Top-10 finalist entry.
- Top 10
- national finalist
- #6
- final private LB
- 10
- segmentation classes
My role
Technical lead — owned the full modeling pipeline end to end (data, architecture, loss, training, inference) for a 3-person team, with two first-year teammates supporting experiment runs and documentation during the on-site final.
Problem
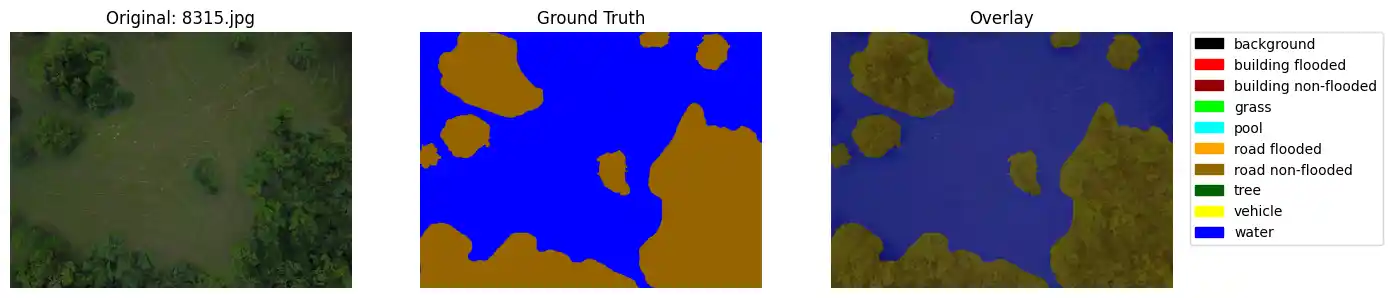
In a flood response, pixel-level maps of what is underwater matter: they let responders estimate affected area, prioritize locations, and make data-driven decisions. The task was semantic segmentation of aerial flood scenes into 10 classes — flooded vs. non-flooded buildings and roads, water, pools, grass, trees, vehicles, and background — scored on mean IoU.
Two things made it hard. The classes were severely imbalanced (water and vegetation dominate; vehicles and pools are tiny), and — the bigger issue I uncovered — the competition's ground-truth masks were noisy, which quietly capped how high any model could score.
Approach
I built a Swin Transformer encoder paired with a lightweight FPN decoder. The encoder's four multi-scale feature maps are projected to a common 256-channel space, smoothed, and decoded into 10-class logits at 384×384.
To fight the imbalance I combined three tactics: a Dice + Focal loss (0.7 / 0.3) with median-frequency class weights, a weighted sampler that oversamples rare-class images, and targeted external data — I pulled only the FloodNet images rich in the two most starved classes (non-flooded building and road), filtered to ≥5% pixel coverage, rather than dumping the whole set in.
Training used AdamW with cosine warm restarts and mixed precision; inference averaged four test-time augmentations (flips + 90° rotation) before RLE-encoding the masks.
Results
- Reached 9th on the semifinal private leaderboard over a 14-day qualifying round, advancing to the national final as a Top-10 team.
- In the one-day on-site final (9 hours of hackathon-style modeling + 6 hours of slides), my model placed 6th on the private leaderboard; the team finished 10th overall once the live presentation and Q&A were weighted in.
- Diagnosed the real performance ceiling: model swaps barely moved mIoU, and the entire final leaderboard sat within a ~10% spread from 1st to 10th (most teams under 2% apart) — a strong signal the limit was label quality, not architecture.
Architecture
A Swin Transformer (swin_base_patch4_window12_384, pretrained, via timm) encoder feeds a small FPN decoder. The encoder's four feature levels pass through 1×1 lateral convolutions into a shared 256-channel space, get refined with conv-BN-ReLU smoothing blocks, and a compact head projects to the 10 class logits. Training ran in mixed precision (AMP) with AdamW and a cosine annealing warm-restart schedule, median-frequency class weighting, and a weighted sampler for imbalance. At inference, predictions from the original image plus three augmentations (horizontal flip, vertical flip, 90° rotation) are softmax-averaged, then run-length encoded for submission.
Technical decisions
- Diagnose before grinding: I started by reproducing a reference paper on the same dataset, but couldn't match its reported numbers. Tracing the gap, I concluded the competition's ground truth had been re-generated with SAM / Grounding DINO and was noisier than the paper's — so I pivoted to a pipeline tuned for robustness to label noise instead of chasing the paper's scores.
- Dice + Focal over plain cross-entropy: Dice optimizes region overlap (good for imbalance), Focal down-weights easy pixels and emphasizes rare classes — the right pairing for a 10-class scene with tiny minority classes.
- Surgical external data: FloodNet was used only for the two starved classes and filtered by pixel coverage; class weights were estimated from the competition stats, not the merged set, because FloodNet's ~55% grass would have skewed the weighting.
- Test-time augmentation: a cheap, reliable accuracy bump given the model was already near the data-imposed ceiling.
Lessons
- The ceiling was the labels, not the model: when no architecture meaningfully beats another and the whole leaderboard clusters within a few percent, the bottleneck is the data. Recognizing that early would have saved experiment cycles — a lesson I now apply before optimizing any model.
- Competitions score more than code: the model ranked 6th, but the team placed 10th once presentation and Q&A counted. The communication and the write-up are part of the deliverable, not an afterthought.
- Leading a mixed-experience team means matching tasks to readiness — I kept the core modeling and handed experiment-running and documentation to teammates earlier in their studies.